Concentration of Measure and Large-Scale Geometry of the Residual Stream
Seeing as so many papers in interpretability and alignment intervene in the residual streams of LLMs, I wanted a better grasp of the large-scale geometry of these spaces. It occurred to me that it was not unlikely for activation vectors in the stream to satisfy an empirical sort of concentration of measure, a phenomenon occurring in probability, or even more generally, metric-measure spaces. Michel Talagrand conveyed his intuition about this phenomenon as follows:
A random variable that depends (in a “smooth” way) on the influence of many independent variables (but not too much on any of them) is essentially constant.
The simplest toy example is the isotropic Gaussian . What happens to as ? A straightforward computation gives : as grows, almost all the mass of lies on a very narrow shell of radius .
Concentration of measure is not necessarily restricted to independent variables. If I instead have and , the ratio is roughly where is the participation ratio, a measure of effective dimension (equals if the variance is spread equally over dimensions). Once again most of the mass lies on a very narrow shell as . Similarly, though the dimensions of an activation vector in the residual stream are not necessarily independent, they could still accumulate on a spherical shell.
To test this hypothesis, among other things, I ran experiments on Qwen2.5-7B-Instruct, with . Feeding in roughly 7,000 documents from Common Corpus, I hooked activations for each layer at token positions 4, 16, 64, 256, and 512 of a random segment of each document. The upshot is that yes, the activation vectors do exhibit concentration of measure about their mean (not at the origin). Click here to skip to the implications.
First, before testing any concentration of measure, the size of the global mean activation vector over layer number and token position:
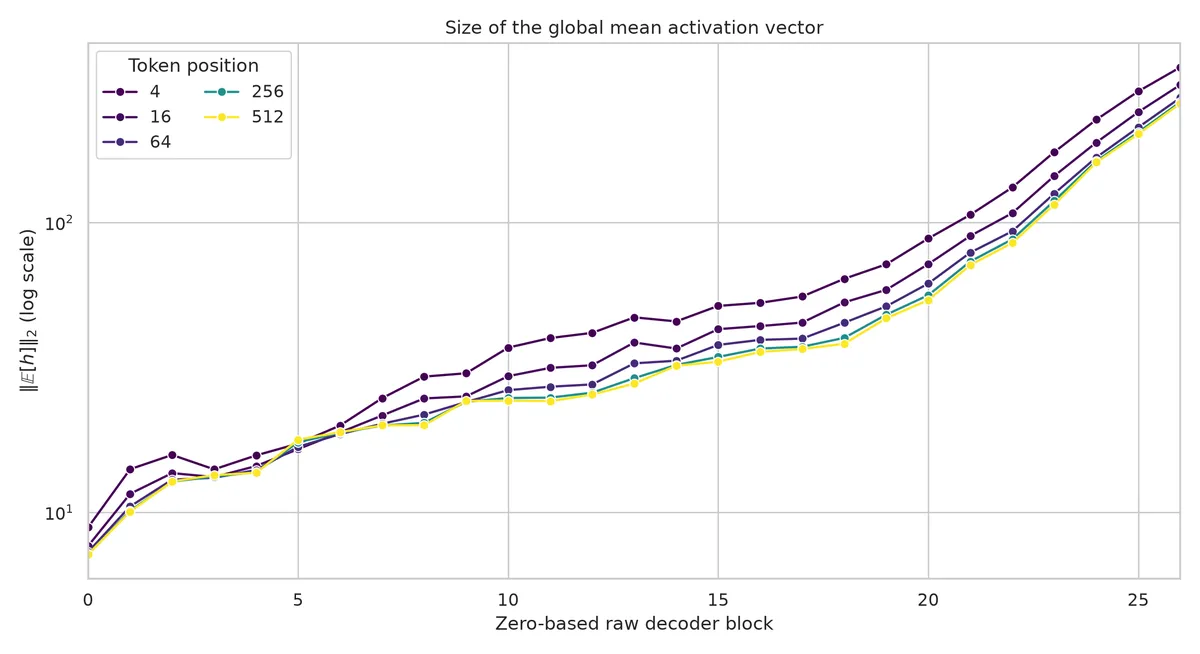 The norm increases deeper into the network and tends to decrease with more context, though it seems to have stabilized around token 256 or 512. This is nothing new; in this model, the transformer layers tend to reinforce each other. I then plotted the angle (measured at the origin) of all activation vectors to their respective mean vector:
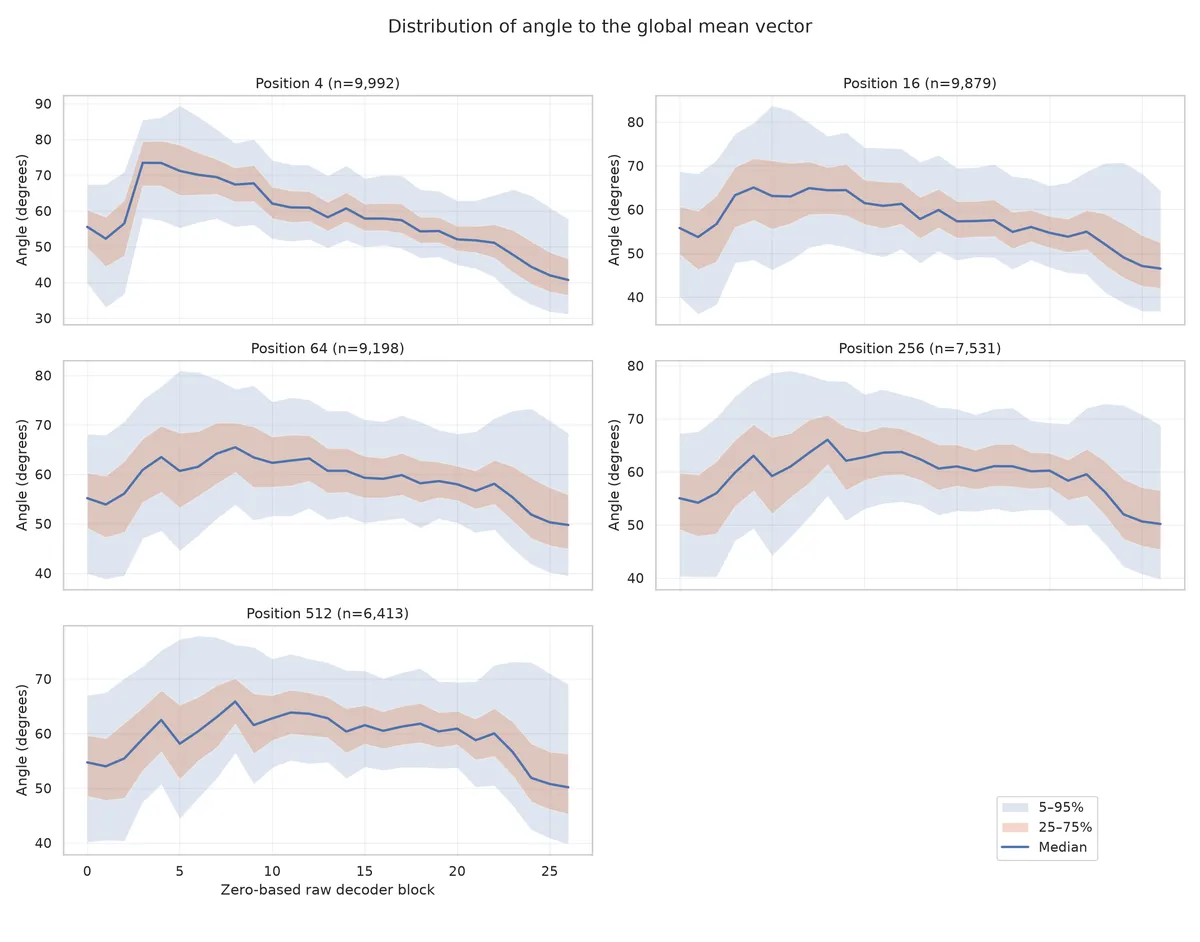 Most of the activations, especially in the middle layers, are concentrated in a band from 40 degrees to 80 degrees to the mean vector.
Since is such a high-dimensional space, two things to keep in mind:
Most of the activations, especially in the middle layers, are concentrated in a band from 40 degrees to 80 degrees to the mean vector.
Since is such a high-dimensional space, two things to keep in mind:
- A cone of 80 degrees around a vector takes up a negligible percentage of the visual sphere; almost any two vectors are orthogonal.
- That there are no vectors within 40 degrees of the mean is insignificant and should not be thought of as a "hole" of any sort; this region is so small compared to the whole space that there shouldn't be anything there in the first place.
All of this is in line with concentration of measure about the mean. This next plot gives the distribution of radii, centered at the mean:
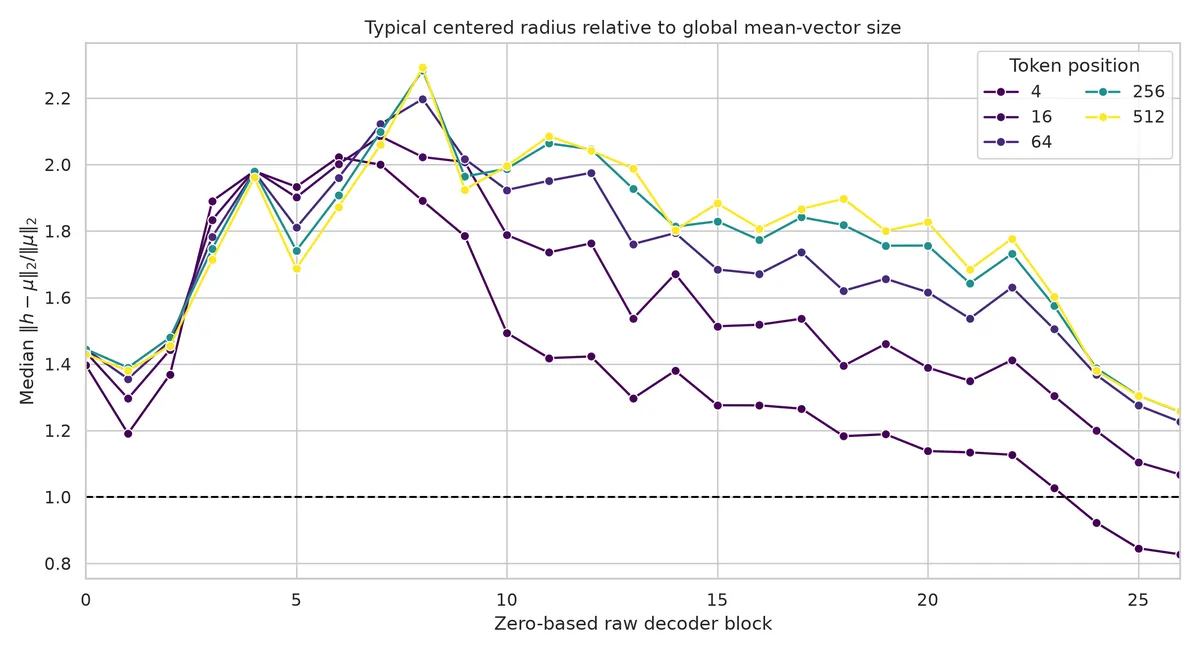
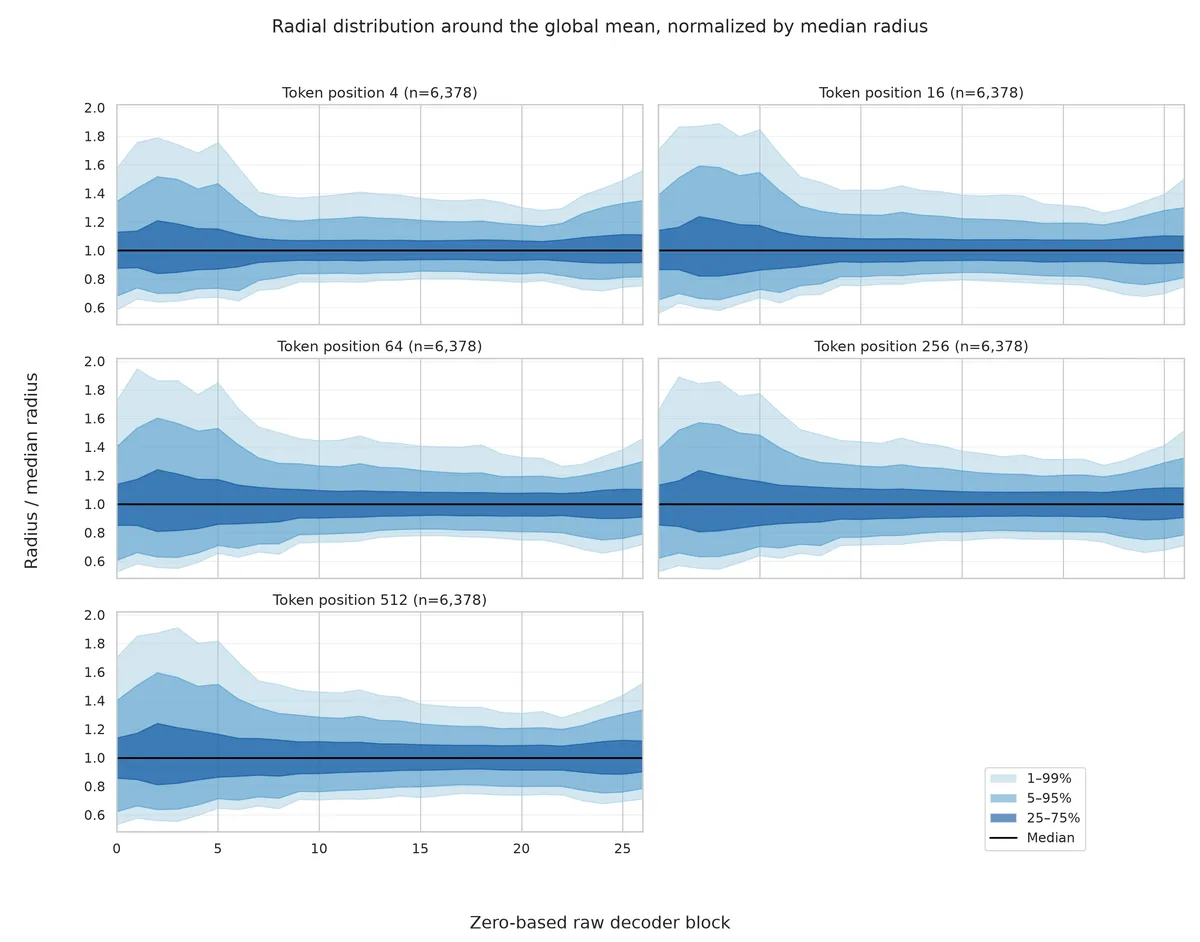 Concentration of measure is apparent: activation vectors form a somewhat thick shell. In the middle layers, almost all activations are within a 0.75 to 1.25 band, where is the median mean-centered radius for the given token and layer pair. Nothing is within 0.5 of the mean. To make sure my mental model had appropriate relative distances, I plotted the median mean-centered radius against the size of the norm vector:
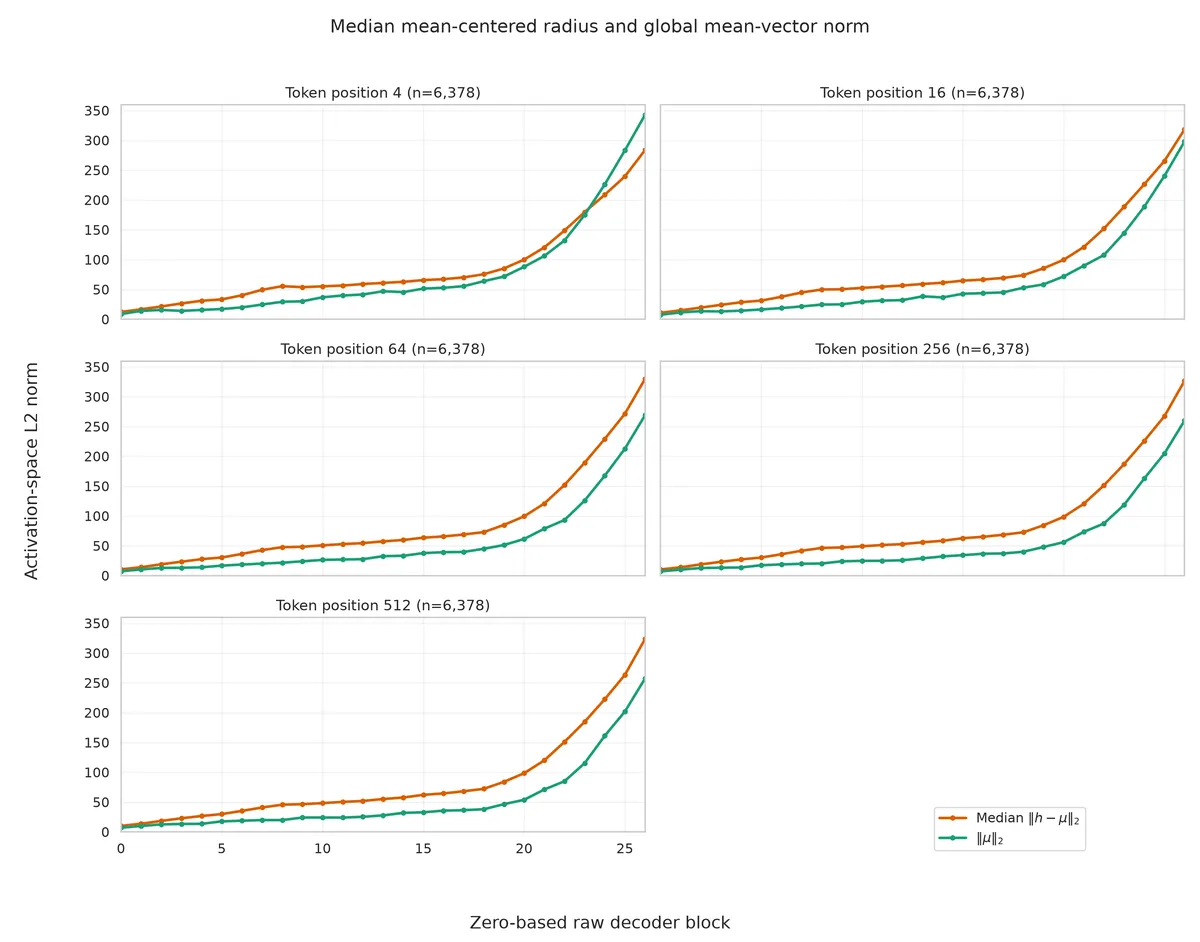 The radius of the shell is mostly larger than , and the median of is remarkably consistent from token 16 onward. Combining this with the statistics on the cosine values between activations and the mean activation, the following picture emerges: all residual stream activations lie on one side of the hyperplane supported by , arranged in a cloud around the mean vector with radius larger than itself. This picture might seem exceptional in three dimensions, but it is par for the course in very high dimensions. A relative comparison of to :
The last thing I wanted to check was the variation around the mean ; it would be very surprising if the directions of were equidistributed. The participation ratio from earlier can give us a rough estimate:
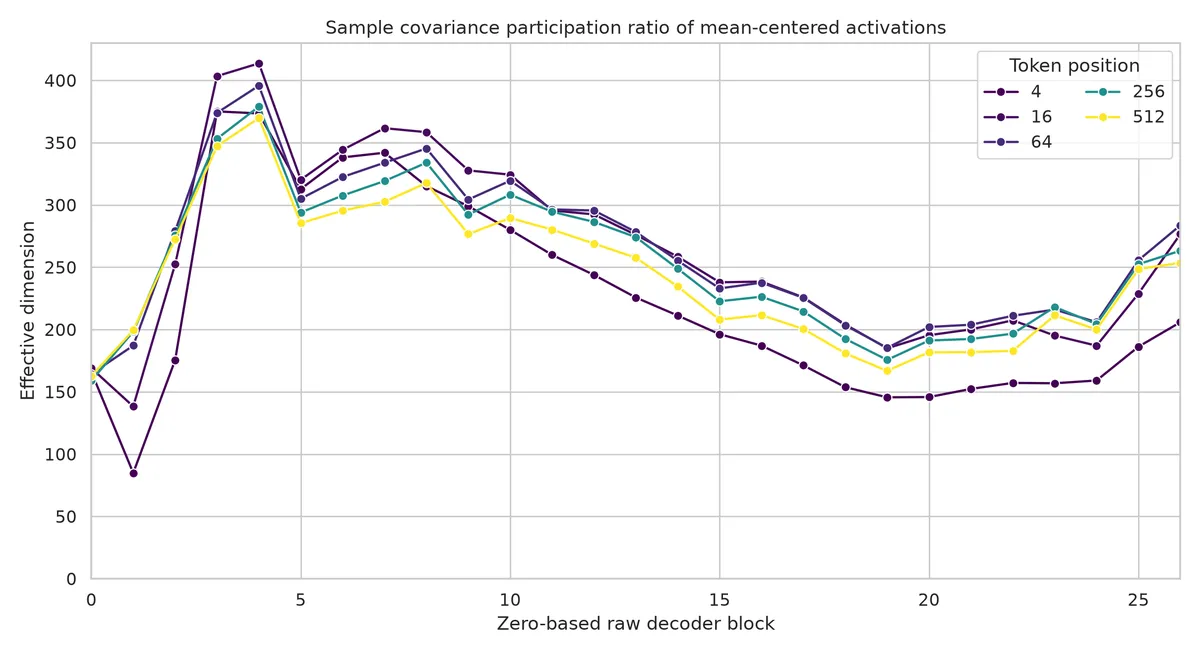 Far, far off from the 3584 that it could have been, it falls off deeper into the network. This could mean that higher-level features don't require as many dimensions to express, which is not unexpected. To focus on the angular variation, here is the same participation ratio but with every normalized to a unit:
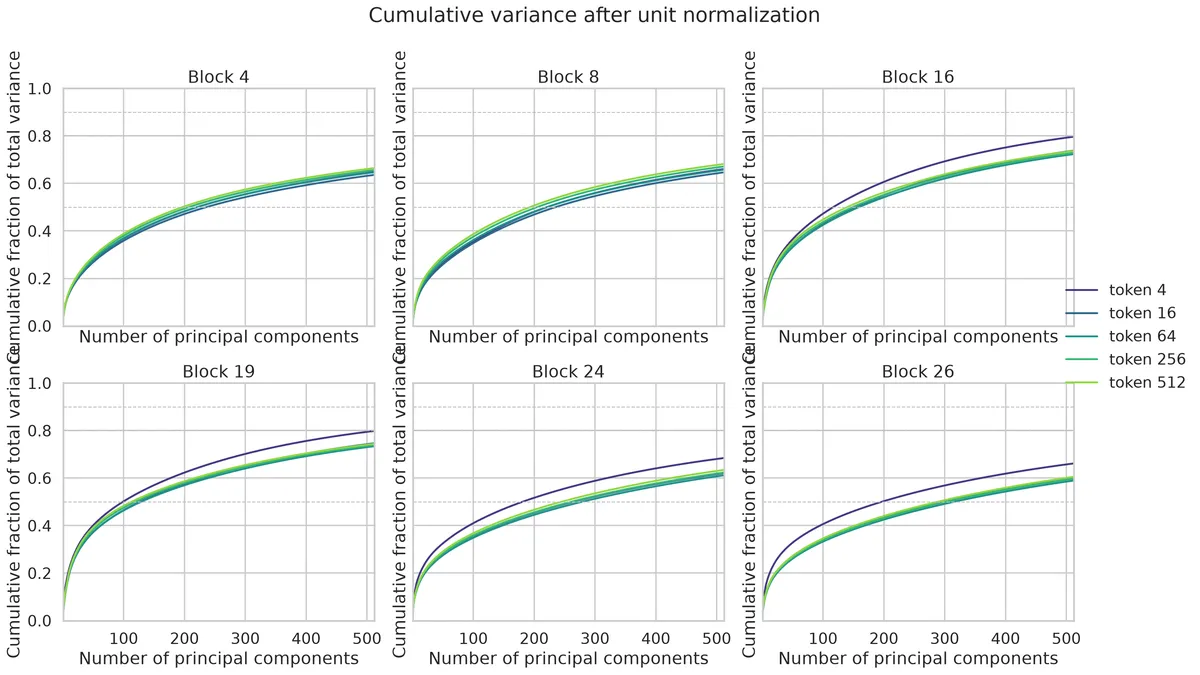
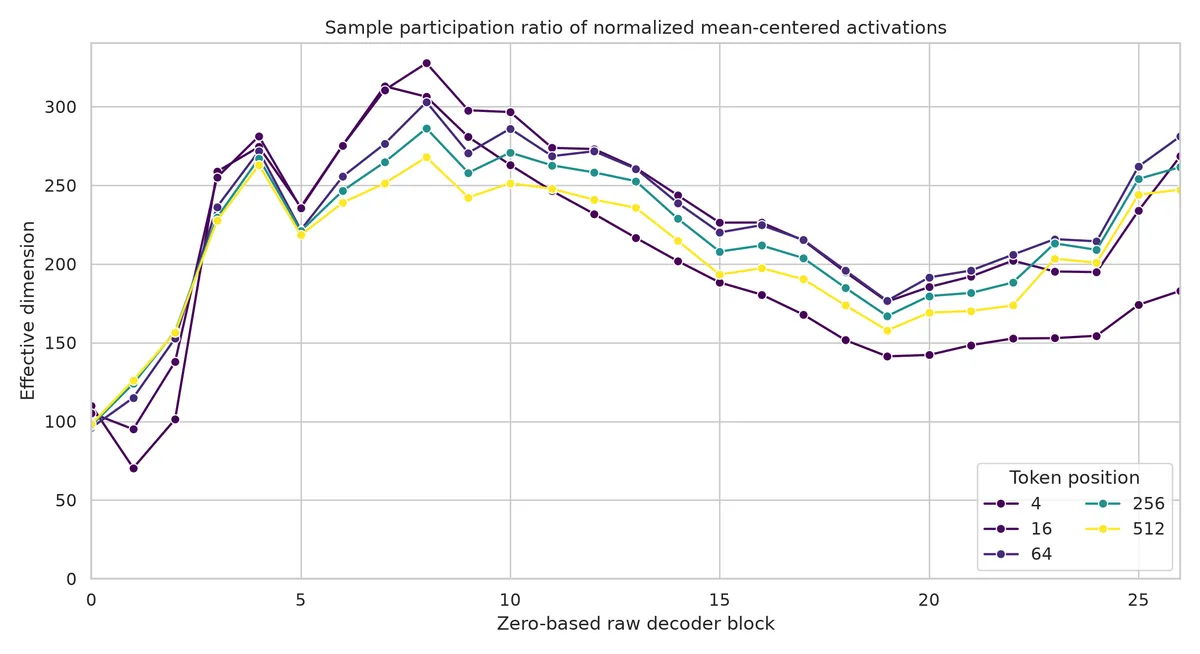 The above confirms that the radial component does not explain most of the variance; most of the variation is angular. To get more fine grained data, I also plotted the eigenvalue spectrum for :
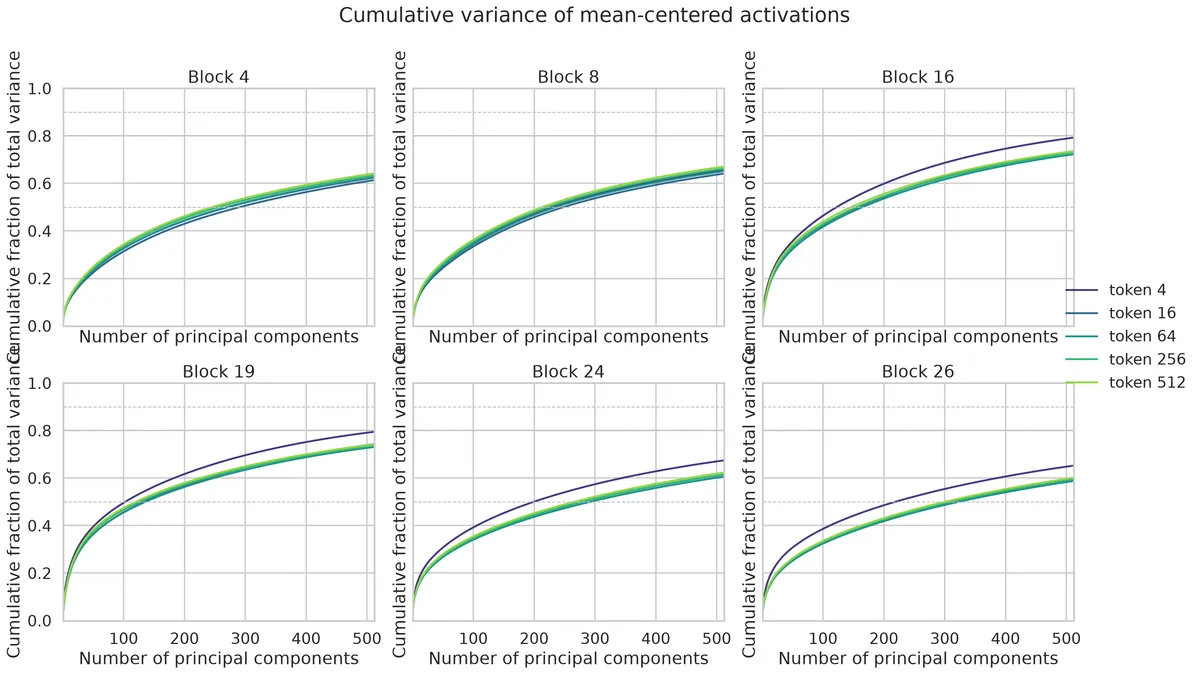 In later layers, 100 directions can explain about half the variance, but it looks like there is quite a long tail. As expected, similar picture arises for the normalized version:
Further Experiments and Conclusions
Some results and thoughts from further experimentation (no plots):
- I chose Common Corpus due to the diversity of text. I obtained similar results using FineWeb. In another experiment, I took 100 fixed prefixes and teacher-forced random 32-token FineWeb completions. The resulting activations also exhibited concentration of measure.
- There are consequences for activation steering. Adding for a steering vector for sufficiently strong could take vectors out of the shell. RMSNorm could fight against this, but the residual stream is still additive, and in general addition seems geometrically ill-posed.
- This paper suggests spherical steering, in which vectors are translated to some degree along a great circle centered at the origin towards a learned truthfulness direction . As an example, for the TruthfulQA dataset, is simply the difference in activation vectors for correct vs. incorrect answers. The authors argue that keeping the norm stabilized respects the geometry of the space. But with a better understanding of the geometry, it might make more sense to fix the distance to the mean of the TruthfulQA dataset (what this entails will depend on the implementation) instead of the absolute norm. I implemented this method of steering and obtained similar performance to the original paper, but I don't think it's worth writing up.
- The points above suggest that initial context might provide a mean activation vector, with further completions forming a cloud around it. In general, then, it seems very difficult to effectively isolate and steer a model towards a target that can arise in multiple different contexts. Chances are there is no global vector that shifts from, say, deception to truthfulness, and works for all contexts. The best one could do is learn a mapping to identify the truthfulness axis depending on the context, but this will almost certainly be a highly complex nonlinear function.
- Conversely, an object like a persona vector could perhaps make more sense, as being "evil" or "helpful" or "sympathetic" is something that manifests itself over longer periods of context. I will try to investigate something like this next.